Here at Data Graphs we have made a really fun discovery: that the principles underpinning domain modeling and knowledge graphs lend themselves perfectly to describing the fine-grained, multi-layered categorization of wines.
We've created an exciting technology demonstration based on X-Wines, an astonishing dataset of more than 100,000 wines made by 30,000 producers in 60+ countries put together by Professor Rogério Xavier de Azambuja of the Federal Institute of Education, Science, and Technology, Rio Grande do Sul, Brazil.
In this article, we describe how we let Data Graphs loose on the X-Wines data, using our GraphRAG AI to demonstrate how our platform has raised the bar and opened up the playing field when it comes to the analysis and exploration of knowledge graphs.
In a subsequent post, we will look in detail at how we applied the principles of domain-driven design to the X-Wines dataset to produce a knowledge graph that offers multiple avenues for search and discovery, including OpenCypher/GQL querying.
Natural Language Queries
Data Graphs' GraphRAG AI allows users to ask questions using natural language – just as ChatGPT or Perplexity do. The difference with Data Graphs is that you are using AI to interrogate your own information, as Paul Wilton explains in his introductory blog-post. In this case, the information in question is a knowledge graph we created from the X-Wines data.
Our Wine Graph domain model is centered around a Wine class:
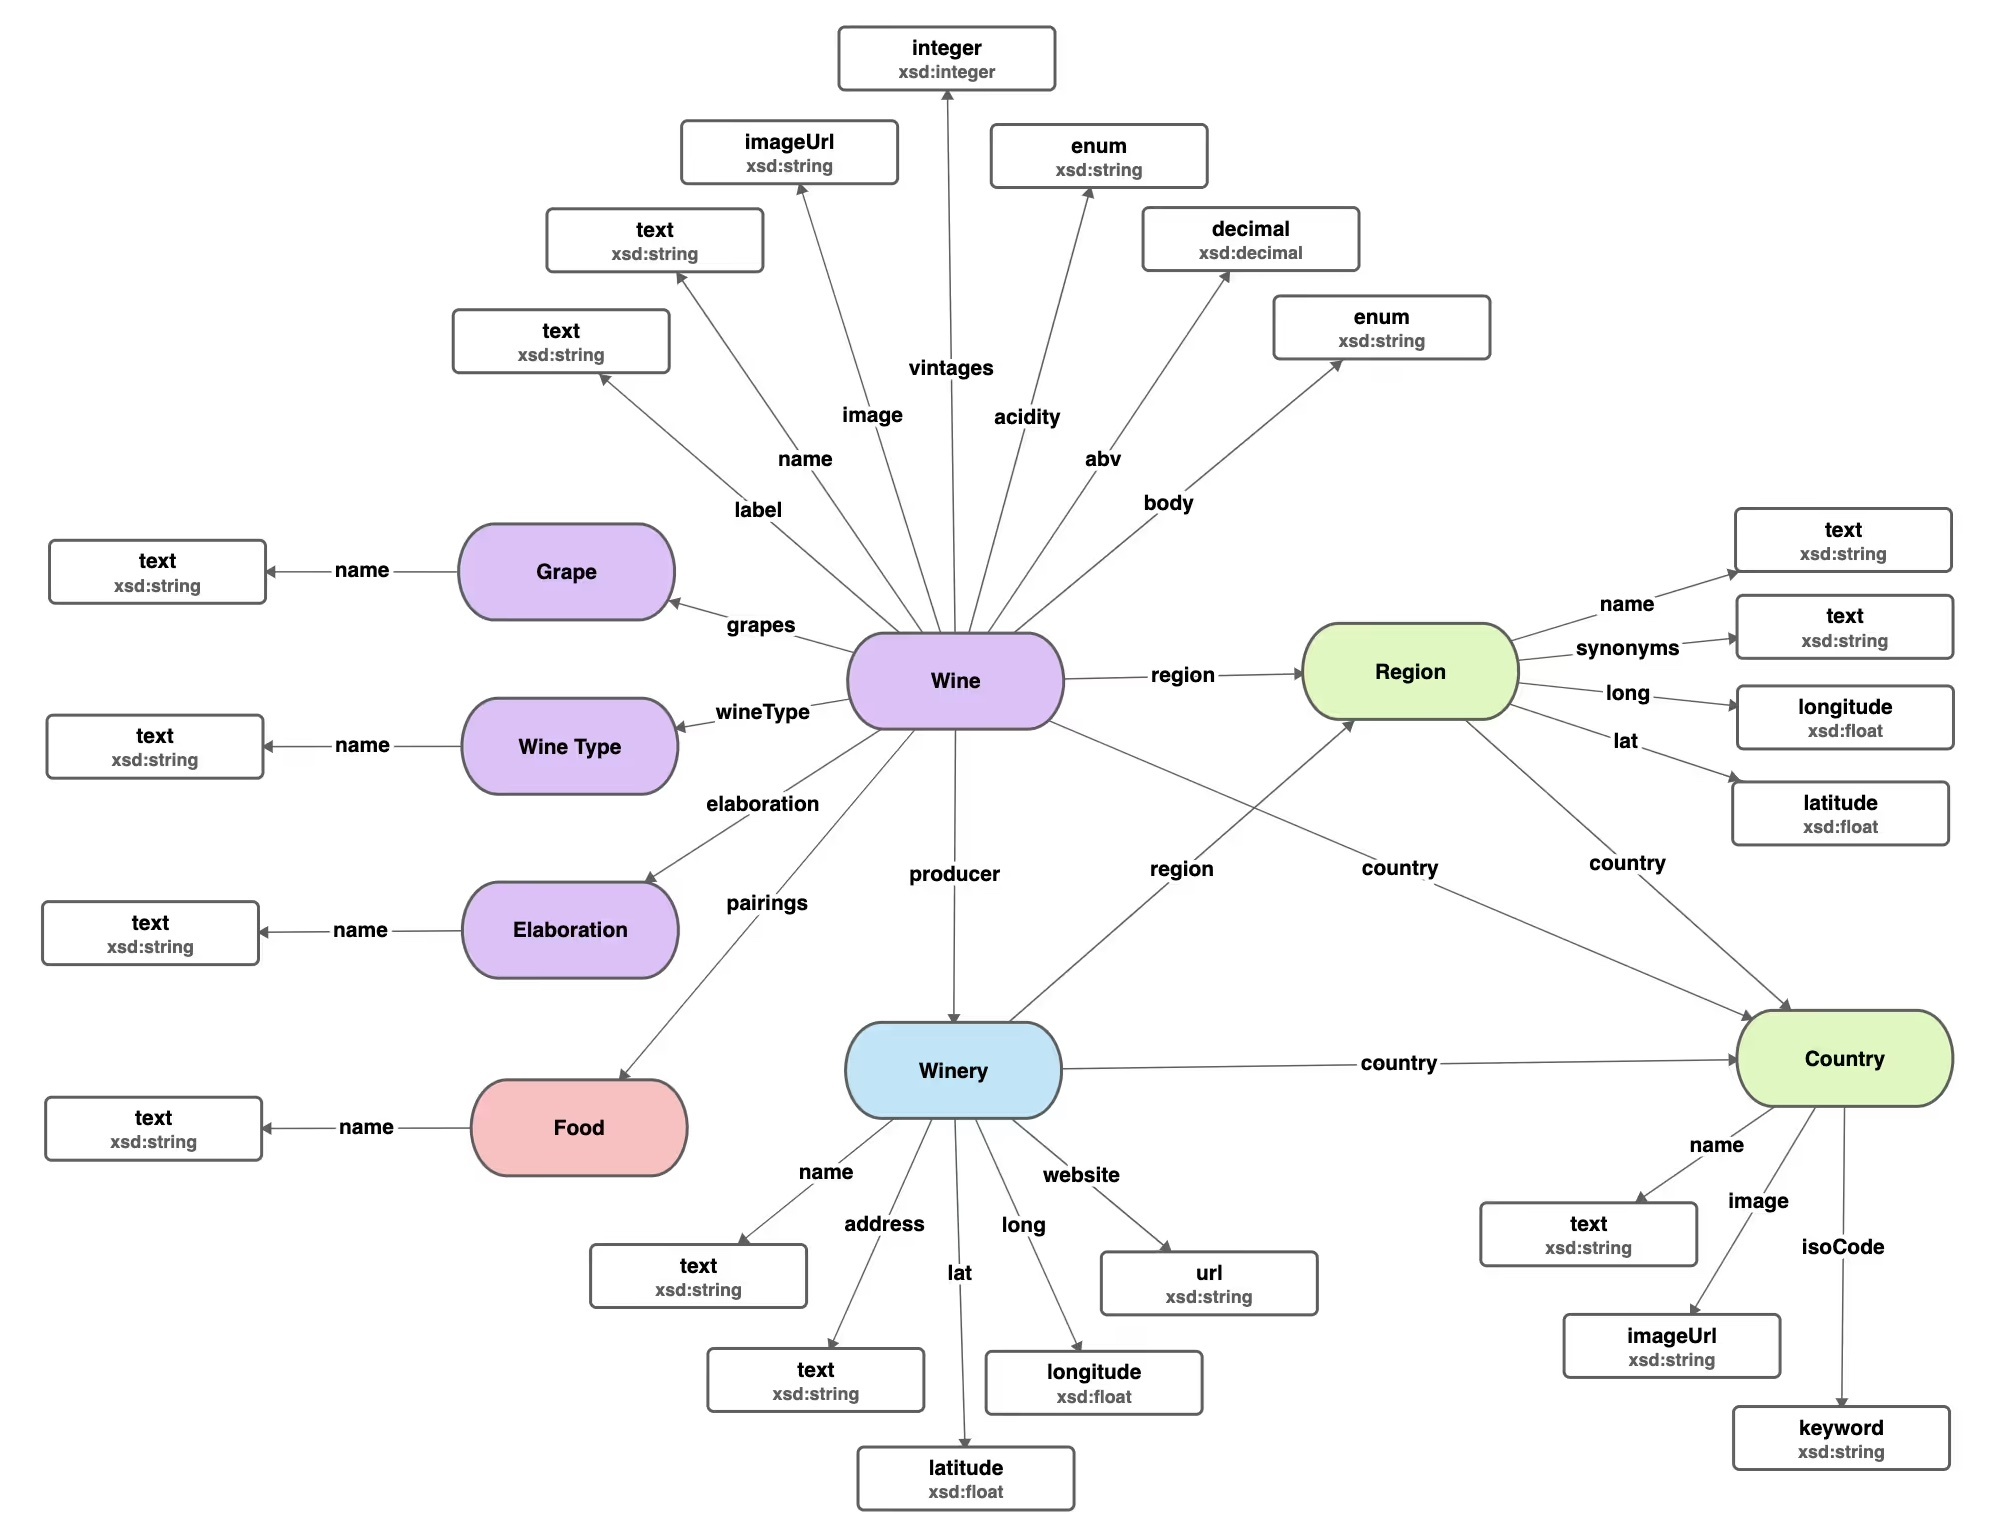
- producer (winery)
- grapes
- body (light, medium, full)
- region
- country
- vintages (the years that the wine has been made)
- pairings (food matches)
- abv (alcohol level)
These properties become the currency of the questions that we ask. In this context, we have found that Data Graphs performs particularly well in three areas, what we might call enquiries, recommendations, and comparisons.
Enquiries
Asking questions that demand an objective response is a good place to start. For example:
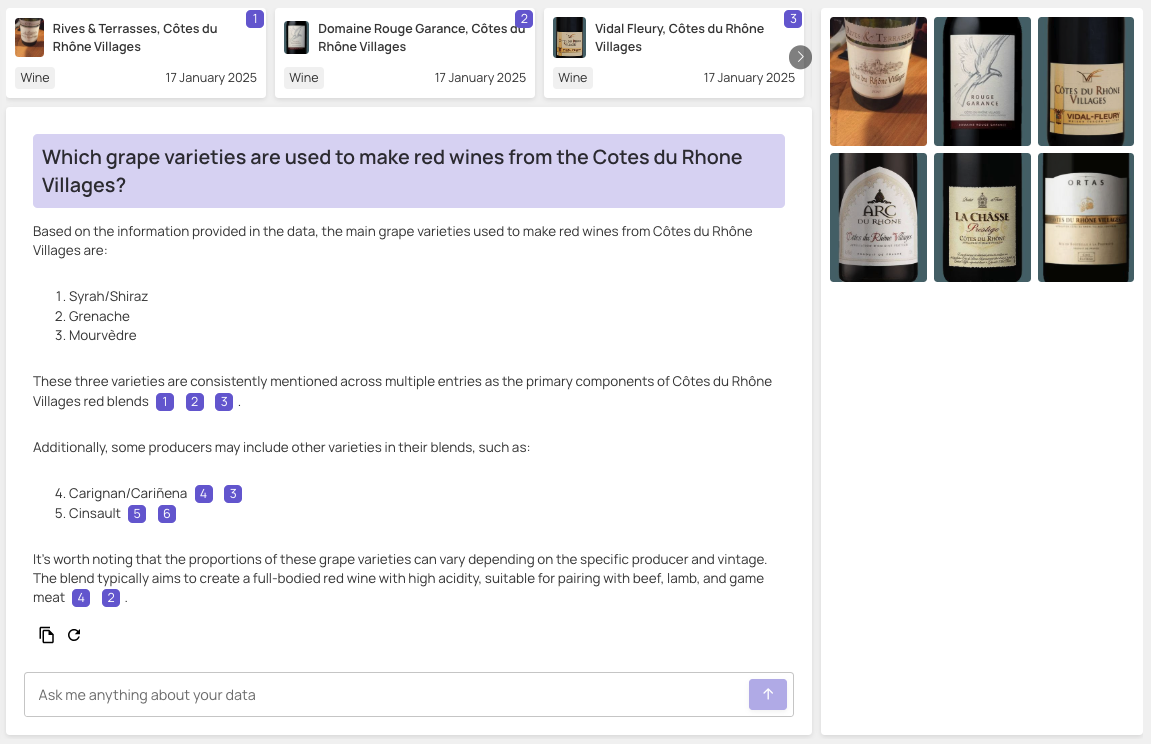
Which grape varieties are used to make red wines from the Cotes du Rhone Villages?
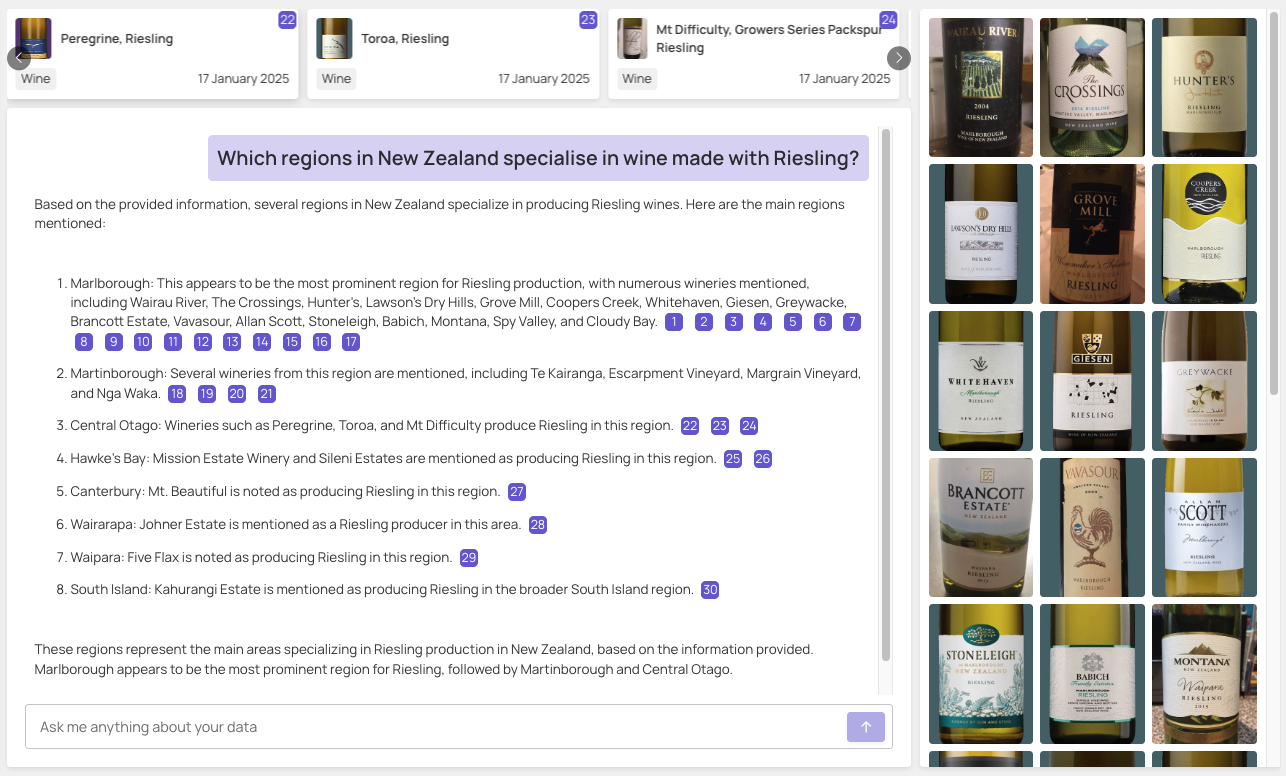
Which regions in New Zealand specialize in wine made with Riesling?
Recommendations
Recommendations are the lifeblood of wine commentary, and food pairings increasingly so. Imagine a sales executive planning a promotion based on wine matched with mushrooms. Or a waitress in a restaurant asked by a customer to find a red wine on their list that goes with fish.
Taking advantage of the pairings property on the Wine class, we could perform a search for wines that go well with spicy food. But with the AI, we can ask a more opinionated question about the relationship between grape varieties and spicy food. For example, we asked:
Which white grape variety is best for pairings with spicy food?
The answer discussed five different varieties, with five wines provided as documentary evidence:
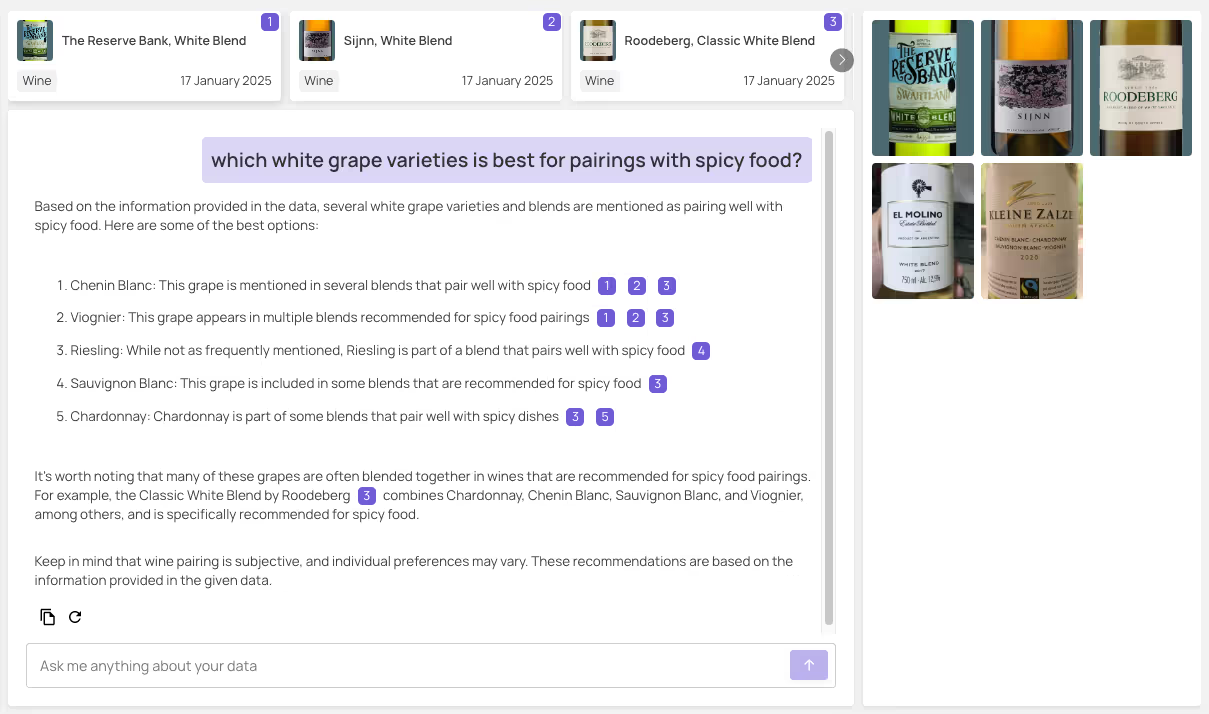
It's worth noting that many of these grape varieties are often blended together in wines that are recommended for spicy food pairings. For example, the Classic White Blend by Roodeberg combines Chardonnay, Chenin Blanc, Sauvignon Blanc and Viognier, among others, and is specifically recommended for spicy food.
Many of us will now be familiar with the scenario where an internet AI provides what appears to be a valuable or interesting response to a question, only to find that it has hallucinated much of it. What's important about the AI's observation about white wine blends and spicy food is that it comes not from an internet search but from its analysis of the data in the Wine Graph. So we can be confident about its veracity.
For any professional looking to understand the details of and patterns within their business information, this kind of unsolicited analysis is invaluable. Of course, it's possible to discover these insights by interrogating the data manually. But this would take time and require a degree of technical and or statistical experience. The value of the GraphRAG AI is not only that the work took a matter of seconds – but that it highlighted a connection that we might not have even known to look for.
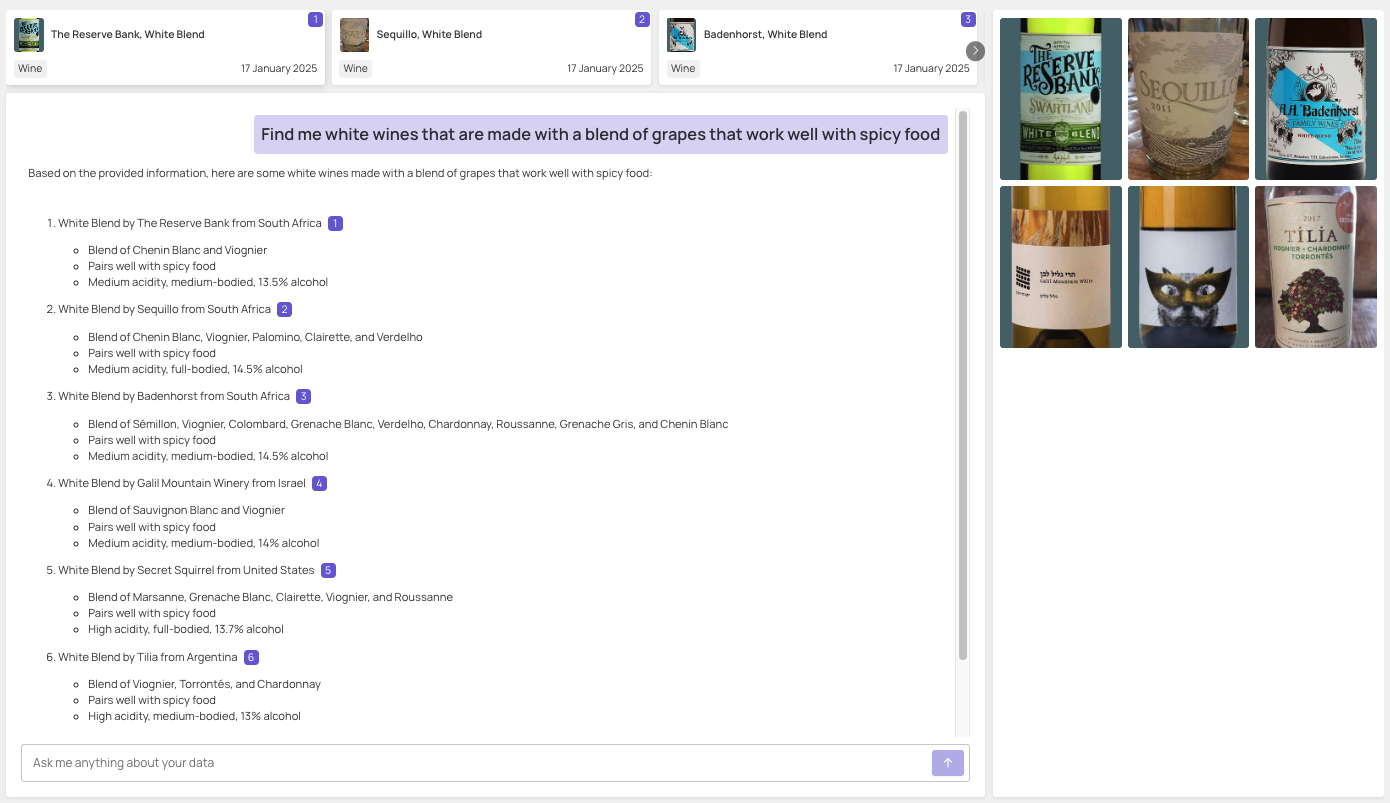
Back to the Wine Graph: with the hint about combinations of grapes, we tweaked the question to focus on blends:
Comparisons
One point about wine that is frequently of interest is comparisons or similarities between different types of wine. For example, a waiter might be asked, "I love Chilean Pinot Noir, but it's not on your wine list. Can you suggest anything else?" Or a marketing executive might be interested in running a campaign based on a particular comparison: "Why wines from Region A are as good as wines from Region B."
So how did Data Graphs' AI perform with this sort of opinionated question?
We started by asking:
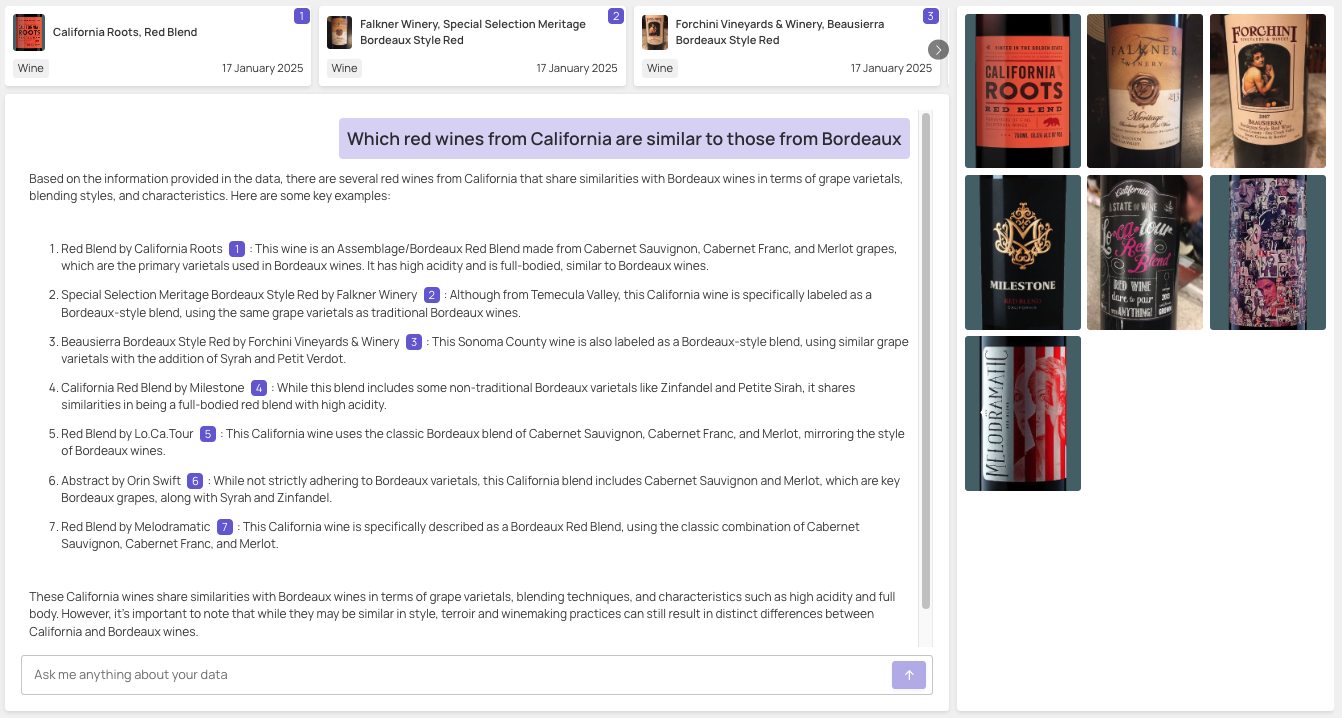
Which red wines from California are similar to those from Bordeaux?
This elicited seven example wines, each with a useful explanatory note:
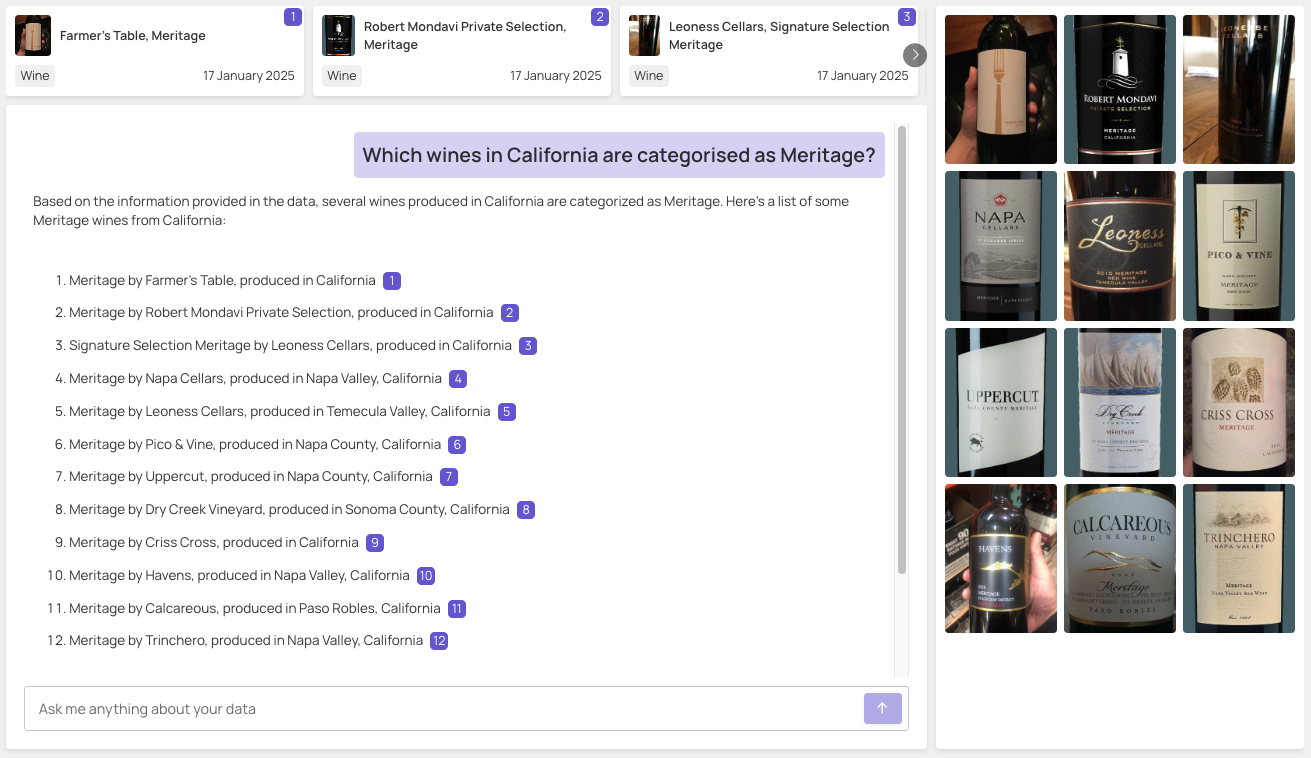
To find California red wines that are truly similar to those from Saint-Julien, you might look for Bordeaux-style blends (sometimes called Meritage) from California that use similar grape varieties and winemaking techniques.
So we put this to the test by asking:
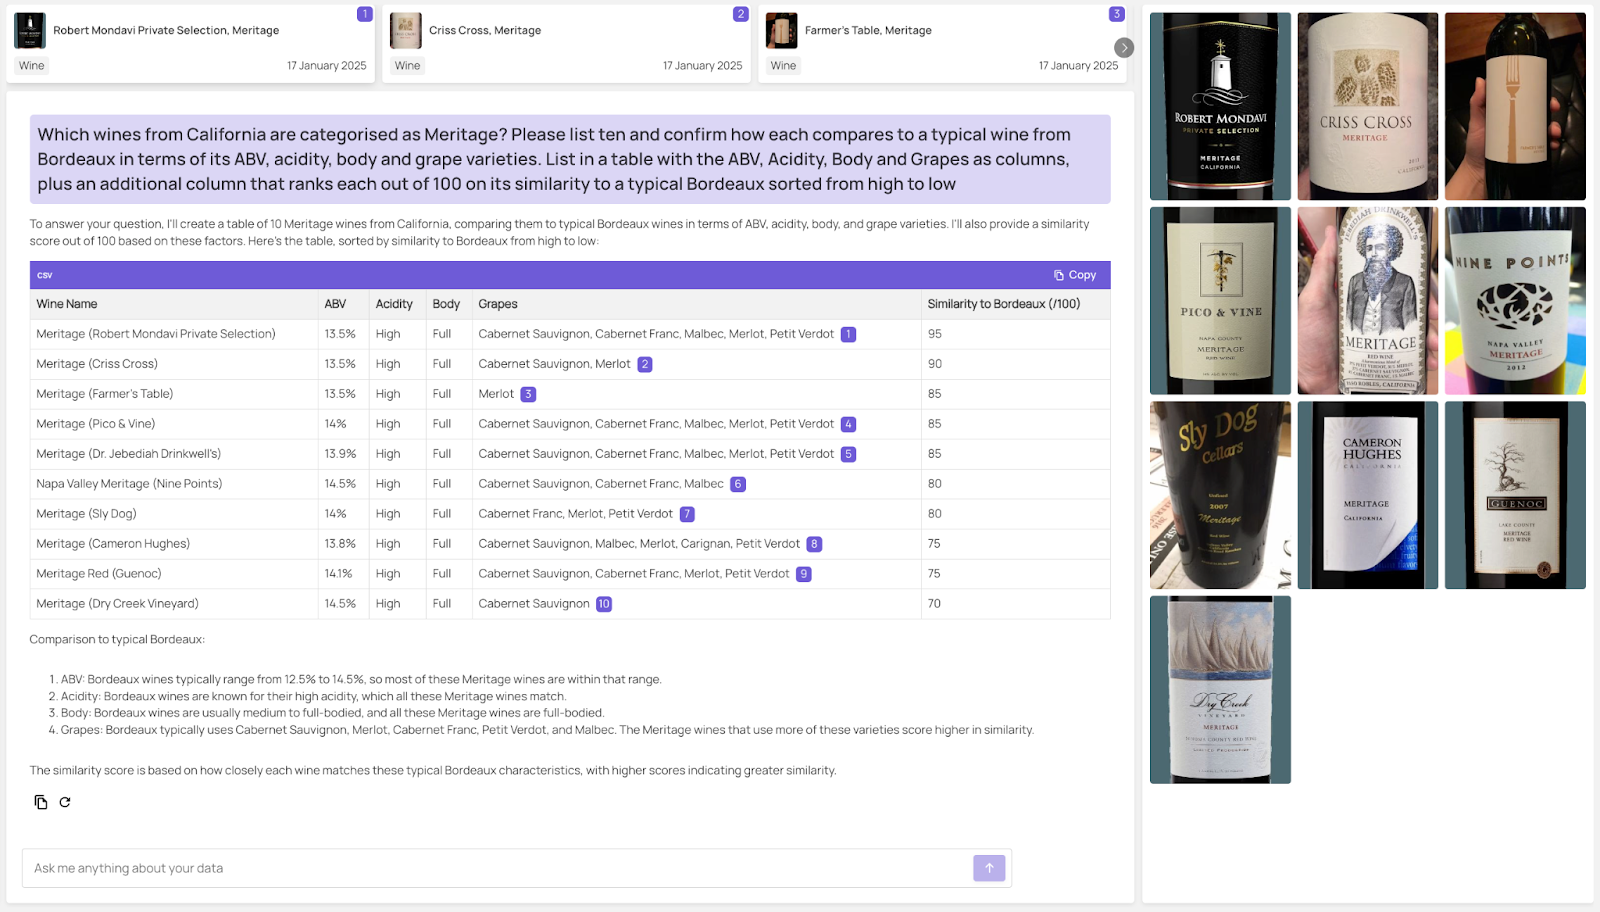
Which wines in California are categorized as Meritage?
Broad Appeal
The knowledge graph we created from the X-Wines data has given us a great opportunity to test Data Graphs' GraphRAG AI on a dataset with broad appeal.
Hopefully, this article illustrates some of the ways our powerful AI tool can help businesses and organizations discover insights hidden within their proprietary data by posing simple real-world questions with no need for technical expertise and without exposing their data to the public realm.
In Part 2, we'll look in detail at how we transformed the X-Wines data into a knowledge graph and how Data Graphs' Graph Explorer and OpenCypher/GQL tools offer more opportunities for search and discovery.
References
de Azambuja, R.X.; Morais, A.J.; Filipe, V. X-Wines: "A Wine Dataset for Recommender Systems and Machine Learning." Big Data Cogn. Comput. 2023, 7, 20. https://doi.org/10.3390/bdcc7010020.