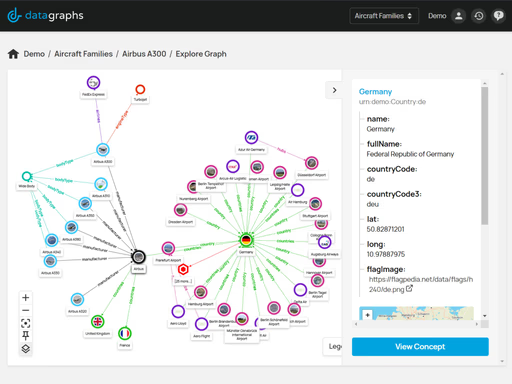
The Graph Explorer feature on Data Graphs allows you to navigate through your knowledge graph visually and interact with your data in a new light. Being able to present your information visually in the Graph Explorer helps provide the context, meaning, and interconnection of your data, an essential asset to your digital transformation.
Demonstrate your Knowledge Graph
A clickable graph user interface enables a visual way of explaining how your knowledge graph can work for your stakeholders and users. This approach enables a clickable journey around your business data so that it brings the key information to life. In our experience this approach generates that "lightbulb moment" that you have been looking for!
Kevin Bacon on Graph Explorer
Here we are exploring the all media data that links to Kevin Bacon... With Graph Explorer you can navigate visually through his films, the countries of those films, other actors he's worked with and much more.
What's the shortest path between Sandra Oh and Ricky Gervais?
Demonstrated below - finding the shortest path between Sandra Oh and Ricky Gervais, with path constraints on other actors and shows between 1990 and 2020, using the Graph Explorer button to visualise the path.