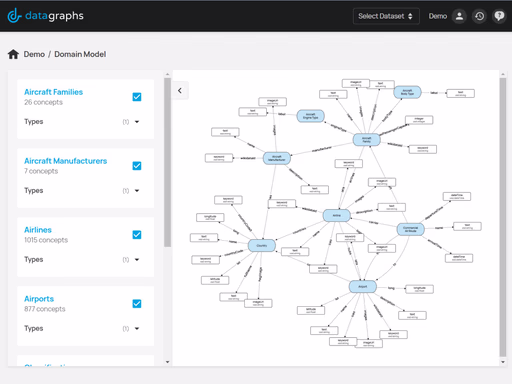
Our knowledge graph product Data Graphs has a brand new feature. You can now view your entire knowledge graph in the 'Domain Model' view. This allows you to see your data presented as a spider diagram and explore it interactively by moving each data point to wherever you like.
Being able to present your data visually is an essential facet in your company's digitisation journey and this new Data Graphs feature makes this simple.
Find out more about Data Graphs and Data Visualisation here.