
We've launched a read-only version of Data Graphs for participants at the Knowledge Graph Conference 2022 to have a go, hands-on.
Data Graphs is our Knowledge Graphs as a Service product. It is used by global brands to provide a knowledge graph platform to accelerate product time-to-value.
Often knowledge graphs are seen as a high-cost and high-risk strategy that only the largest of companies can implement, over a very long time.
With Data Graphs, we've ensured that businesses can see value rapidly. Specifically, this means speeding up the ability to do proof of concepts, and simple but informative demos that allow organizations to realise early value at low cost and low risk. Here's an example of one of those demos right now.
When developing Data Graphs, we wanted to make the setup and creation of a knowledge graph, simple and quick.
This video, prepared for KGC2022, shows how we created a knowledge graph, complete with secure API and powerful UI tools, ready for production, in 13 minutes:
This demo version was created using Netflix, Disney+, AmazonPrime, and Hulu data, and gives you a good view of just some of the key Data Graphs features.
After you have designed and created your domain model with the business entities and the relationships that link them together, Data Graphs generates a visual representation of the model so that you can see clearly how the knowledge of your business interconnects.
Check out the Domain Model for Shows, Cast, Genres, Ratings here.
The search capabilities of Data Graphs are stellar and allow you to find and explore your data precisely and most importantly, quickly. With the Advanced Search feature, you can build complex queries by chaining and grouping a series of boolean and numeric expressions, to pinpoint the targets of your search.
Test the search capabilities of Data Graphs here, on 115k concepts including shows, cast, directors, genres, countries, and more.
As well as an intuitive visual search tool, all the Data Graphs search features are available via API so you can integrate them with your business systems and apps.
Explore the Data Graphs API here.
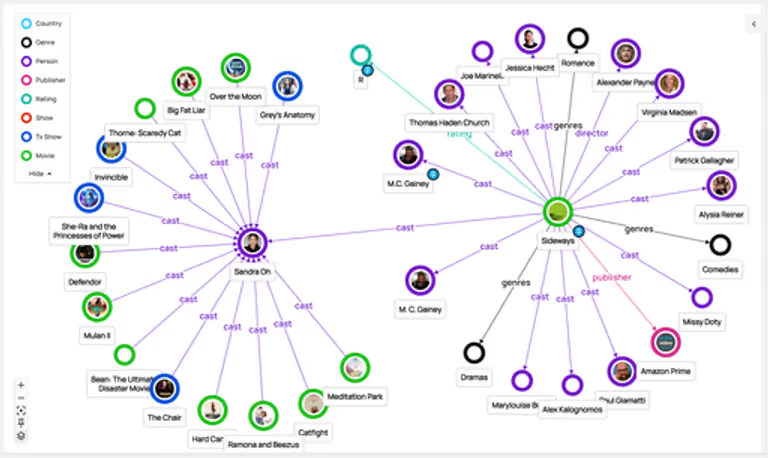
The graph explorer is one of the star features of Data Graphs. You can now visualise your knowledge graph in an interactive representation of your data, that you can then explore and dive into, using the nodes. By visualising your entire knowledge graph, from any concept in your dataset, we open up a wealth of possibilities for your structured data.
Interact with the knowledge graph explorer here, starting from the "Stranger Things" node.
Data Graphs lets you visually explore paths between any entities in the graph, in order to find the shortest paths, and to specify constraints on both nodes and properties that make up these paths. A key feature of knowledge graphs, this type of analysis is typically used in compliance, fraud detection, and supply chain analytics.
You can try out the graph path analysis here.
The Data Graphs demo is a read-only view of the full version of Data Graphs. The complete product provides a full suite of tools for curating, ingesting, editing, and maintaining data in a knowledge graph, along with APIs for integration of your graph data with apps and business systems.
The media graph data has been sourced from the open data provided by Netflix, Hulu, Amazon Prime, and Disney+ via kaggle.com here. The data sets from these 4 publishers have been cleaned, loaded, and linked together in our graph to join 72k actors and directors across 21k TV shows and movies, all faceted by genre, rating, country, and year of production.