For some time now, Data Graphs has been fully multimodal, allowing images, audio, and video, as well as written content, to be represented directly in the graph, and even uploaded and hosted on the platform.
We have launched a new feature that allows data and content in the graph to be viewed in context, navigated, explored, and even edited visually. We call these Render Views.
What are Render Views?
- Rich Visualization: Define a view that retrieves the entity and surrounding graph data for a visually stunning, in-context experience.
- Multimodal Ready: Works seamlessly with images, audio, and video directly within the graph. Videos can be played right in the view!
- Simple Creation: Render templates are configurable per class and can be styled easily.
- Edit in Context: A feature that allows for simple, in-line editing of data properties directly within the view.
How they work
Data Graphs is entity and model-centric. We tend to deal with statements about things at the entity (subject) level rather than the statement level, and as such, our data views show the JSON data of the entity, drilling into its relations and properties.
Our new Render Views allow us to define a Cypher or GQL query starting from the entity being viewed, pulling in as much or as little of the graph surrounding the entity as needed, and rendering a rich visualization of the entity graph. These Render View templates can be configured for each Class of entity in the graph, using handlebars scripts and stylesheets to generate the view. When combined with multimodal content graphs, they can be used to generate some very rich, expressive user experiences.
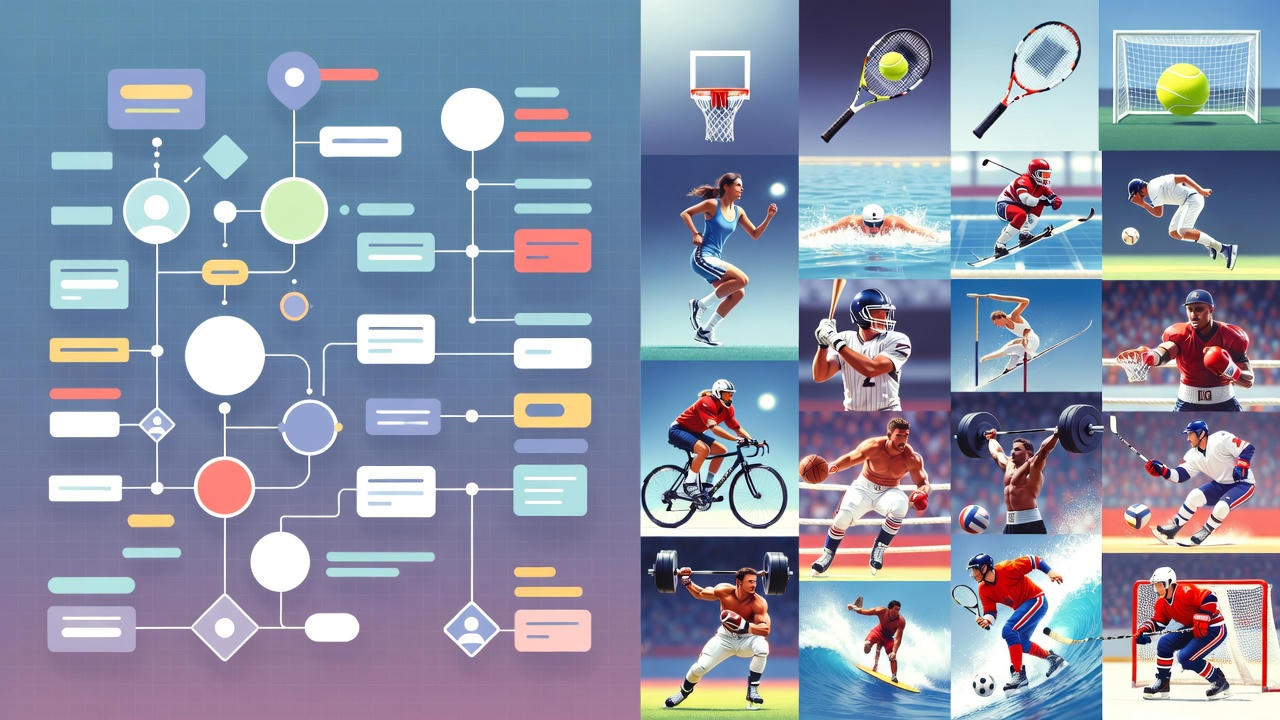
As an example, in our Sports Media Demo using the SoccerNet dataset, our standard data views show us the structured data of the entities conforming to the domain model/schema:
By configuring a preview template around the Event class in the above example, we can pull more data from the graph surrounding the entity and render a view of the data in context.
Render Views can be styled to match an organization's style, or even to match a published view on a website or app that is consuming the data.
For multimodal content in the graph, the videos can be played directly in the render view.
While these Render View templates appear to be potentially complex to create, they are in fact straightforward. You don’t need to be an expert developer. In fact these sports demo templates were vibe-coded and styled using a simple prompt by a non-developer, pointing the AI Agent at the graph model, and the JSON data.
Style
How to render and style these views is entirely optional based on the use case.
The views above are highly stylized and reflect how you present this data to your end users. You could also opt for simple tabular views (Excel style) or something entirely novel. You can also create multiple views per class. For example, in the above sports demo, you could have the stylistic versions above, and a simple sports-stats tabular view alongside it.
Editing data using Render Views
The Data Graphs Render Views can also be used for editing data directly in context and in-line. This was, in fact, a customer request, and the entire feature was customer-driven.
With simple configuration, the properties rendered in the view can be marked as editable, enabling an edit icon to appear for each property. Clicking the edit icon opens a small modal that lets the user edit the property in context. This edit-in-context feature is widely used by our AgriTech users.
Want a demo?
We have examples of these features in a number of domains. If you would like a demo, please do get in touch.